Part 2: How to communicate your Innovation Barometer
|
Part 2 is designed to help: → Decide on the amount of resources to allocate to your communication effort → Find tips on your communication at the start of the project → Integrate communication into your project mandate and budget → Customise content to match target audiences → Expand the time period and number of occasions for communicating Innovation Barometer news → Involve collaborators and stakeholders in your communication efforts → Learn more about how to produce good case studies → Establish a visual identity |
|
Table of contents: 2.1 High return on investment in communication 2.2 Customise content to match target audiences |
2.1 High return on investment in communication
A traditional way of communicating statistics is to begin by writing a lengthy report based on months of careful analysis and interpretation. Then, in the capable hands of the communications department, it is made available for download on your website, and communications does its utmost to get media coverage of the main findings. In this part, we provide advice on how to increase the return on your investment in an Innovation Barometer by thinking differently about communication.


"An effective statistical report tells a story about the data. Stories engage people and they endure. When you find and tell the story about your data, there is a better chance of engaging with the general public and informing public policy.
Always aim to write text that a journalist can copy and paste. Being quoted is the best way to ensure that your story is read the way that you intended it to be."

Helen Cahill, Statistician
Editorial Board, Central Statistics Office, Ireland


ACTIONABLE ADVICE 2.1
AVOID LETTING YOUR NUMBERS STAND IN THE WAY OF YOUR MESSAGE

On their own, statistics are just numbers. To mean anything, their value must be brought to life and the goal is to turn data into information and information into insight. To make the statistics more tangible:
- Have public employees actively working with innovation share their personal interpretation of your data.
- Find good case studies that showcase what the numbers mean – focus on the people and the stories behind the numbers.
- Have experts give advice on how to deal with some of the difficult aspects that the statistics uncover.
- Use the numbers as a tool to tell stories on specific public sector innovation topics.
- See how it's done at the UN: link here

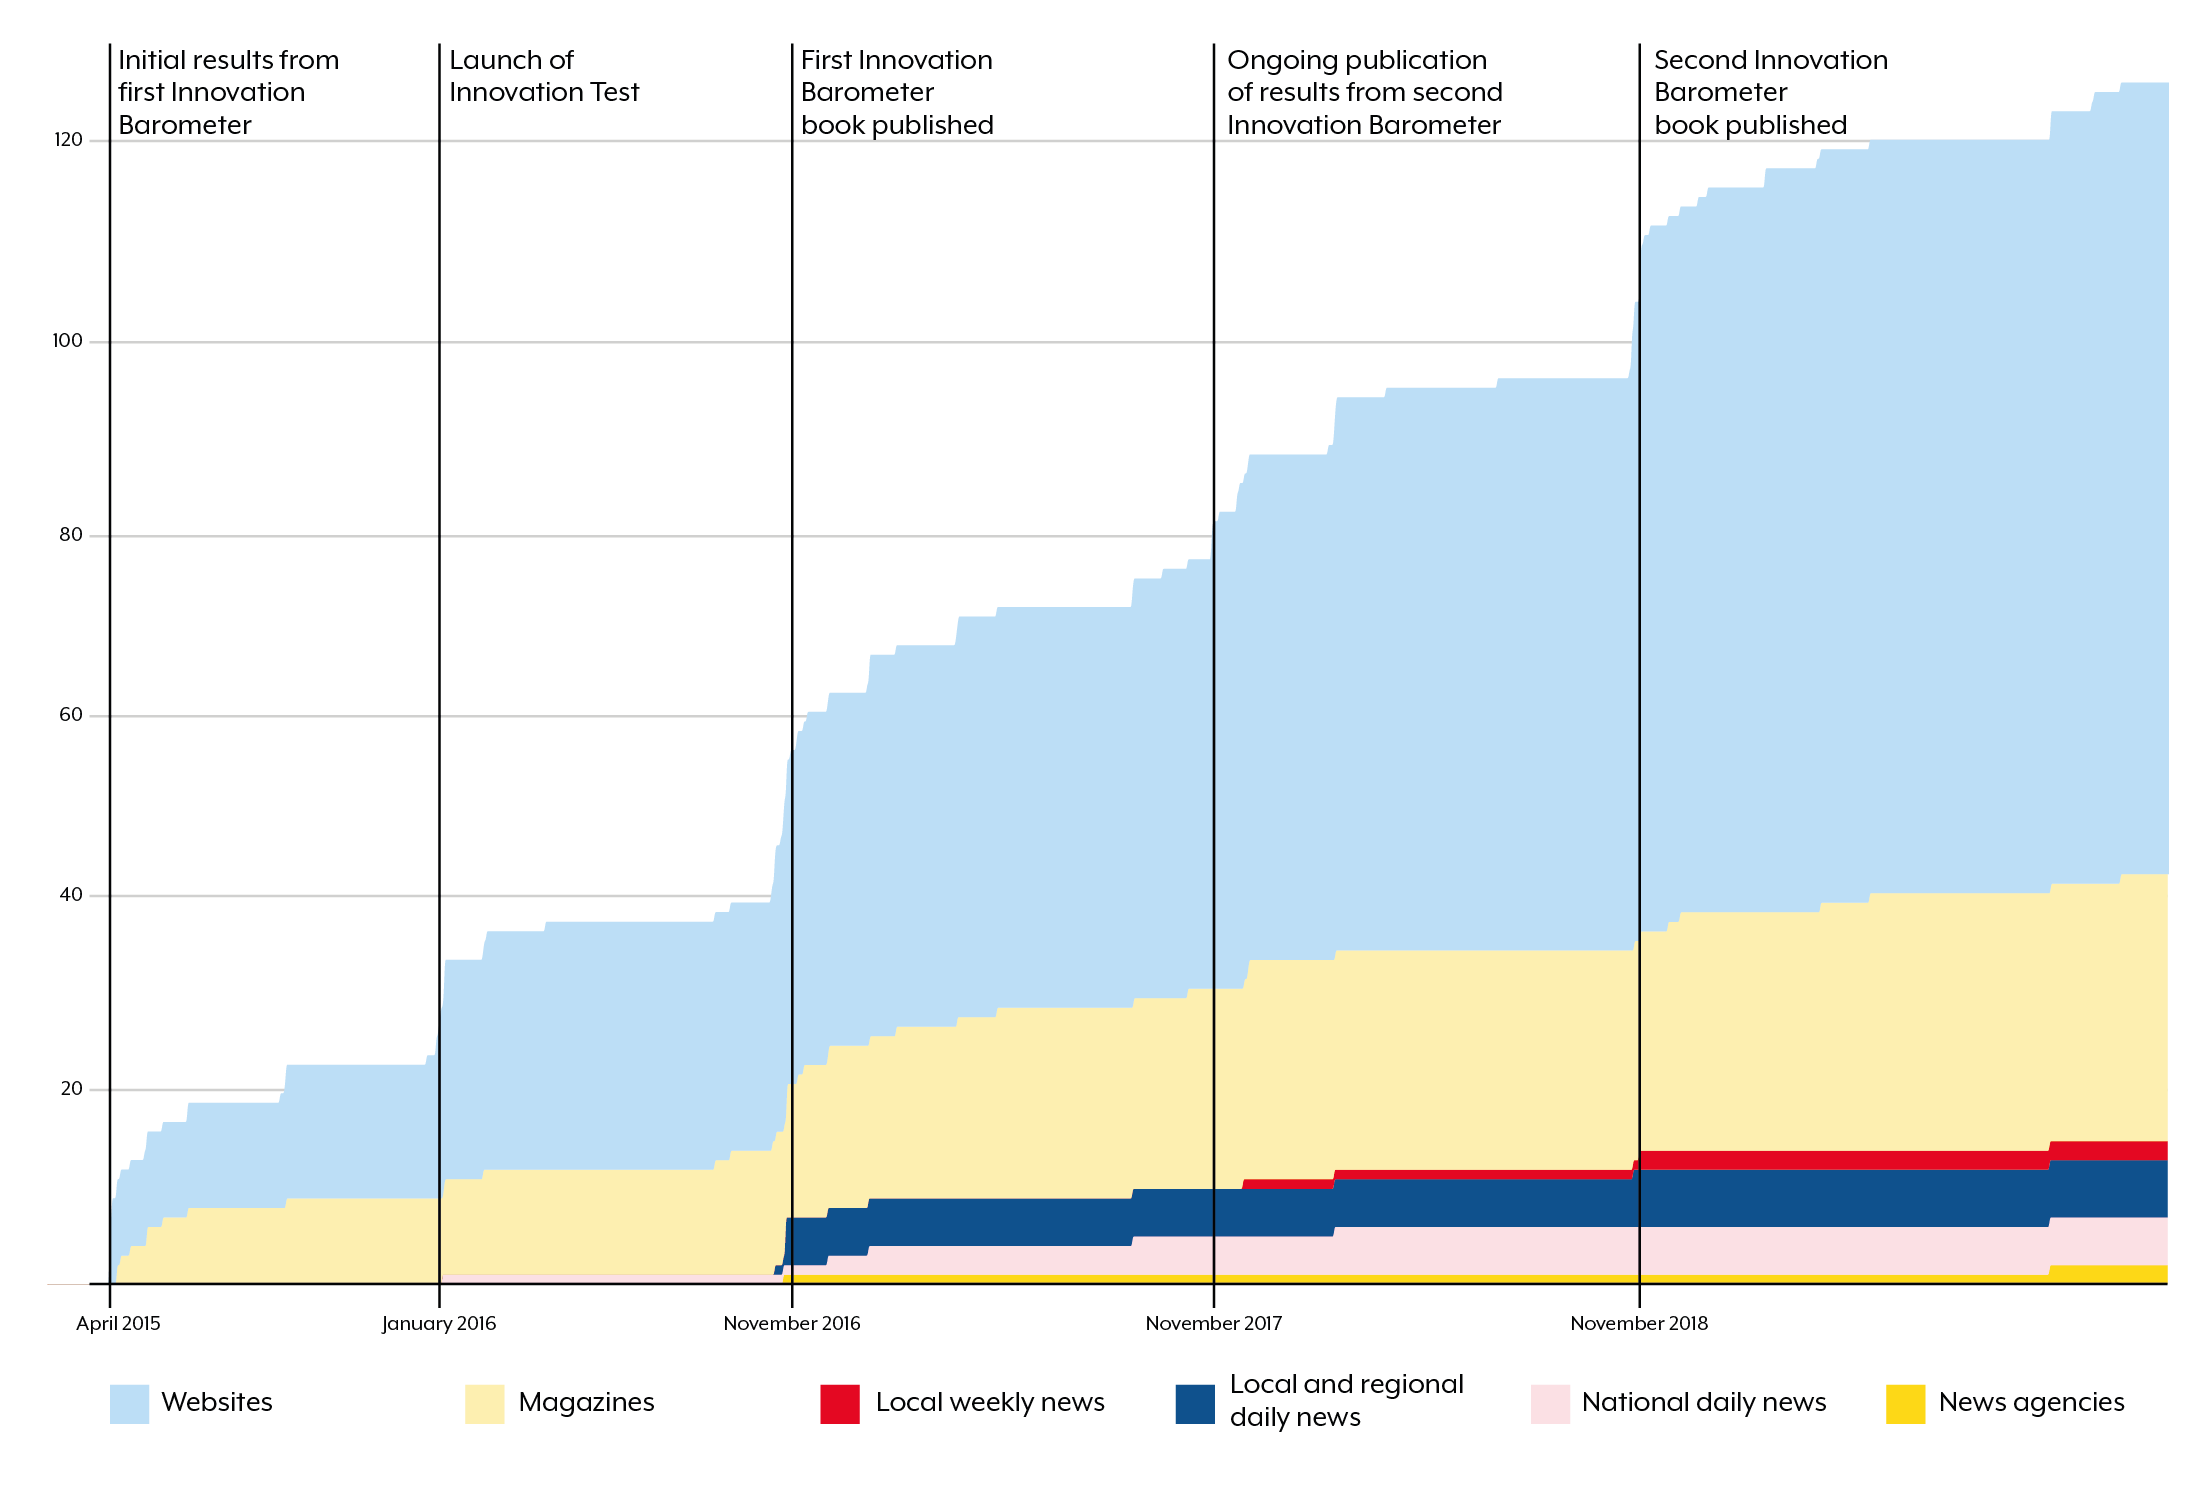
The results of the first Innovation Barometer in Denmark were published in March 2015, based on data collected in 2014. Since its publication and as of December 2020, Denmark has completed three Innovation Barometers. Following a traditional approach, this would have translated into three reports and three waves of news exposure – if the coverage was successful each time. However, by working in a radically different way the Danish Innovation Barometer was mentioned 132 times in 102 different news media outlets over the five and a half years since its launch.


USE CASE
MORE RESOURCES SPENT ON COMMUNICATION THAN ON DATA
From the start COI chose to spend more time and money on communicating the results than collecting and processing data. This decision has paid off in numerous ways, including excellent media coverage.

Most media coverage originates from COI's own press releases. However, a large and continuous flow of stories also generated public use of Innovation Barometer data not directly initiated by the COI. For example, the news media often used Innovation Barometer data in articles on the public sector.

The most important and overarching piece of communication advice, especially if you have limited resources available, is not to think of communication as a separate task to be dealt with after the actual work is done. From the very beginning, think of communication as an integral part of your Innovation Barometer work, as this very thinking will increase both the potential resources that can be (re)allocated into successful communication and your chances of reaching your strategic goals and intended audience.
You can expand your reach by planning and initiating your communication early on, by finding partners and by developing formats to match your target groups. In this part of the manual, we show how others have done just that.


ACTIONABLE ADVICE 2.2
PLAN, INITIATE AND INTEGRATE COMMUNICATION WORK EARLY ON
- Plan and initiate communication efforts as early as possible – and certainly before collecting data
- Establish a clear link between your strategic purposes for doing an Innovation Barometer (Part 1) and your early thoughts concerning communication
|
Why – or for what purpose – are you doing an Innovation Barometer (Part 1)? |
Who are the relevant target groups that you hope to inform, help, influence or engage with your Innovation Barometer? |
What data do you need to collect and from whom (Part 4)? |


USE CASE
THE NZ INNOVATION BAROMETER PROMOTION VIDEO
In New Zealand the NZ GovTech Hub developed an introductory video that explains the Innovation Barometer and its purpose.
The deputy chief executive who signed off on participation in the project is also featured in the video, which also explains why his agency is participating, what the benefits are and what excites the agency about the Innovation Barometer.

The absolute amount of resources meaningfully spent on communication naturally depends on the overall budget and your scope, target groups and strategic goals. When looking to include the resources spent on communication into this pool of decisions, it can be helpful to do a thought experiment.
Consider all the resources your contributors must invest. If 2,000 public sector managers spend 15 minutes each answering the questionnaire, this adds up to about three months of work time. Your own organisation or collaborators will spend at least the same amount of time completing the data collection and analysis. If nobody is aware of or uses your findings, then these hours were wasted.
The point to stress here is that it is not advisable to spend six months collecting and processing data and then only spend the last day communicating the report. This approach means risking that only very few people will read your report.


ACTIONABLE ADVICE 2.3
(RE)ALLOCATE RESSOURCES TO COMMUNICATION
- Introduce a narrative on the potentially lost impact if you do not prioritise solid efforts to communicate the Innovation Barometer results
- Identify the communication resources in your organisation and any collaborators working on conducting the Innovation Barometer survey
- Include these communication resources early on in the process
- Look for advice and input from the communications resources early on
- Identify communication platforms and outlets and prioritise what is easily accessible and what demands more effort. If you have few resources – pick the low hanging fruits and one or two bright apples higher up.

A strategy for optimising the return on communication resources is to take advantage of external factors. Keeping an eye out for items that Innovation Barometer results can be linked to will help you disseminate your results to a broader audience. For example, if the government has announced a reform in a particular field and you have data relevant, plan to communicate your results in this context as well.


ACTIONABLE ADVICE 2.4
UTILISE EXTERNAL RESOURCES
- Keep an eye out for current agendas that the dissemination of Innovation Barometer data can be linked to.
- Co-create communication efforts with collaborators and stakeholders to add insights and reach a wider audience.

Another way of utilising external resources is to invite your partners and stake- holders (Part 1) to take part in both the specific design of communication products and the subsequent dissemination. When your partners become co-writers or co-creators, it adds insights and credibility to your Innovation Barometer findings. When your partners actively share the messages or products in their own networks, for example on social media, you reach an often highly relevant audience that may otherwise be hard to access.


USE CASE
TWO PARTNERS – LARGER AUDIENCES
The Danish Innovation Barometer is a joint venture between Statistic Denmark and COI. Both partners communicate about the findings on their respective platforms.

Statistics Denmark communicates new statistics via:
- News from Statistics Denmark – An online newsletter with many subscribers.
- STATBANK Denmark – An online database where anyone can download data for free in user friendly formats. Data are also available in English, for example, innovative workplaces in the public sector by sector and type of innovation.
- Its website, dst.dk/en, which also contains a detailed description of the Innovation Barometer, carried out according to international standards.
- Data for research. International researchers can gain online access to anonymised micro data (individual personal or corporate) if affiliated with an authorised environment in Denmark, e.g. a university.

COI continuously communicates on topics related to the Innovation Barometer through channels such as:
- COI newsletter
- Press releases
- Infographics shared on social media
- Books and online publications
- Websites:

Sometimes there is the risk of downgrading communications at the end of the project, e.g. if resources are tight. However, by integrating communication in the project plan (preferably from the beginning) you significantly reduce the risks of cutting communication resources.


ACTIONABLE ADVICE 2.5
INTEGRATE COMMUNICATION IN YOUR PROJECT MANDATE AND BUDGET
- Make sure that communication is included in the project mandate, e.g. by making it part of the project goal or a specific sub-goal.
- Include communication in the project budget.
- Organise the early involvement of expert communication professionals, either from a specialist in your own organisation or external consultants.


USE CASE
CONFERENCES AS A COMMUNICATIONS PLATFORM
One of the criterions of success for the Norwegian Innovation Barometer was that the mayors who make up the political leadership of the Norwegian Association of Local and Regional Authorities would embrace the findings. The Association released the Innovation Barometer for municipalities at its annual summit for mayors. The local politicians learned about the key findings and embraced them. Since then, the findings have been used at other meetings and events across the country, helping the Innovation Barometer became part of the story of an innovative municipal sector.
The main findings of the Norwegian Innovation Barometer for the state sector were first presented at an established, well-visited management conference in Norway. Even though the Innovation Barometer was still under completion, which means a final version was not yet available, it had its own spot on the programme. However, presenting at a conference with the Innovation Barometer’s most important target groups in the audience was a good starting point and provided a taste of what was to come. One result was that the Ministry of Local Government and Modernisation and its Secretary General also became key actors in communicating the Innovation Barometer's findings.

2.2 Customise content to match target audiences
To achieve the largest possible impact from your Innovation Barometer, tailor your communication to the most relevant format for each target group.
The first Danish Innovation Barometer used data to produce a/an:
- Credible report to convince scholars and policymakers
- Pamphlet with 10 pieces of advice for practitioners
- Set of cases for the media
- Book used at educational institutions
- Set of infographics for social media
- Online self-evaluation tool
Some inspiration to guide your segmentation:
If your aim is to inspire public sector practitioners and innovation professionals, handbooks and online guides will probably fit your purpose better than a thick report. If you want to appeal to scholars and high-level decision makers, a systematically documented report and careful interpretation may be necessary.
If increased legitimacy is important, consider writing an authoritative book with all the data contained in other communication products. A book is referenced by others writing on public sector innovation and can be lent at public libraries. A book is reviewed. And a book increases the likelihood of the Innovation Barometer becoming part of the syllabus at educational institutions.


ACTIONABLE ADVICE 2.6
CUSTOMISE FORM AND CONTENT TO MATCH TARGET AUDIENCES
- Research the preferences of your specific target group and customise form and content for each group.
- Test the wording, use of language and tone of voice on specific user groups, for example by befriending your local communication/language expert.
- Consider what format is used on various platforms for each target group:
|
|
Name of target group 1 |
Name of target group 2 |
Name of target group 3 |
|
Handbook |
|
|
|
|
Online tool |
|
|
|
|
Freely available report |
|
|
|
|
Textbook |
|
|
|
|
Peer-reviewed article |
|
|
|
|
Infographics |
|
|
|
|
Blog |
|
|
|
|
… what caught your eye |
|
|
|


USE CASE
TAKE AN INNOVATION TEST
In Denmark and Sweden, COI and SALAR (The Swedish Association of Local Authorities and Regions), which both produce Innovation Barometers, offer online self-evaluation tools – innovation tests – that let interested public employees and political leaders answer questions from the Innovation Barometer questionnaire and immediately receive visual comparisons of their own workplace with the national average. Both online tools aim to create curiosity, dialogue, learning and reflection.


USE CASE
THE HANDBOOK NYT SAMMEN BEDRE (NEW TOGETHER BETTER)
Since the findings in the second edition of the Danish Innovation Barometer did not differ significantly form the first, there was little reason to update an earlier book. Instead, COI chose a new format – a handbook – to provide an in-depth look at one theme: collaboration on public sector innovation.
The handbook NYT SAMMEN BEDRE (NEW TOGETHER BETTER), available in Danish only, is for public sector practioners who seek inspiration to create new solutions in collaboration with actors outside their own workplace.
It is not necessary to read the entire book as it contains a section on various types of collaborators:
- Other public workplaces
- Citizens
- Voluntary organisations
- Knowledge institutions
- Private companies
- Private foundations
- International partners
Each section contains practical advice, tools, cases and infographics based on Innovation Barometer data.

It is not necessary to communicate everything to everyone simultaneously. The same numbers and findings can easily be produced in various versions and presented differently depending on which target group you are trying to reach. In this way, an Innovation Barometer becomes more durable, prolonging its newsworthiness.
Dividing messages into smaller, more accessible communication pieces also makes it easier for more people to find the time to digest them. Indeed, you may think of communications as a cake, better served in small, delicious slices instead of over- whelming portions.
A few particularly interested individuals may have an appetite for more information, which is why it must be made available through, for instance links, detailed tables and descriptions of the methodology.


ACTIONABLE ADVICE 2.7
PUT THE CONTENT INTO BITE-SIZED CHUNKS
- Make a plan for what results will be communicated to specific target groups, on which platforms and when.
- Make theme-based releases aligned with your primary focus, e.g. collaboration on public innovation, citizen engagement or the role of politicians.
- Spend time and energy suitably communicating about each part.
- Make it easy for target groups to access more in-depth results and data if they are hungry for more.


USE CASE
INNOVATION CALENDAR SPURRED ATTENTION
Prior to the launch of the Norwegian Innovation Barometer for local government, the Norwegian Association of Local and Regional Authorities selected ten thought-provoking findings and presented them like an Advent calendar to generate a sense of anticipation. Each flap stated, “Did you know ...?” followed by a new fact. A month before the launch, the Association began opening the flaps one by one at varying intervals. To read the findings interested parties had to sign up for a newsletter, and many quickly did. The Association promoted the Innovation Calendar in its general newsletter and on social media to create interest and curiosity before the full release.


When communicating various results to a variety of target groups at different times a strong visual identity can serve to unify the results. Establish a design manual that defines the colour palette, font and individual elements such as templates for cases and figures.
Consistent use of design features and reusing formats can increase the likelihood of recipients recognising you as the sender of the message.
A simple design manual will get you a long way but must be adhered to strictly. If a creative format like infographics is preferable, then you will probably need help from a professional graphic designer, which costs time and money but adds a professional shine your results, an investment often rewarded with a bigger audience.
As a cheaper alternative, stick to a program like Excel and apply your design manual to increase readability and make your charts stand out in a crowd. To make charts attractive for social media, use large font sizes and minimise details like axes and grids.


WARNING!
Do not expect the numbers alone to be a storyteller. Some target groups will not think they are as interesting as you do.


ACTIONABLE ADVICE 2.8
ESTABLISH A VISUAL IDENTITY
- Use a design manual to create a consistent visual identity.
- Find your own unique – and recognisable – style to communicate findings, e.g. through infographics.
- Repeat features in your communication, e.g. by using the same template for cases each time.
- Add your logo to figures to be cited automatically as the source.


USE CASE
INFOGRAPHICS
COI uses infographics created by professional graphic designers to make results more engaging than ordinary numbers and charts do. A chart can be simple and attractive or done even more creatively. Infographics convey a large amount of information using minimal text and are suitable for not only printed media but are also social media friendly.
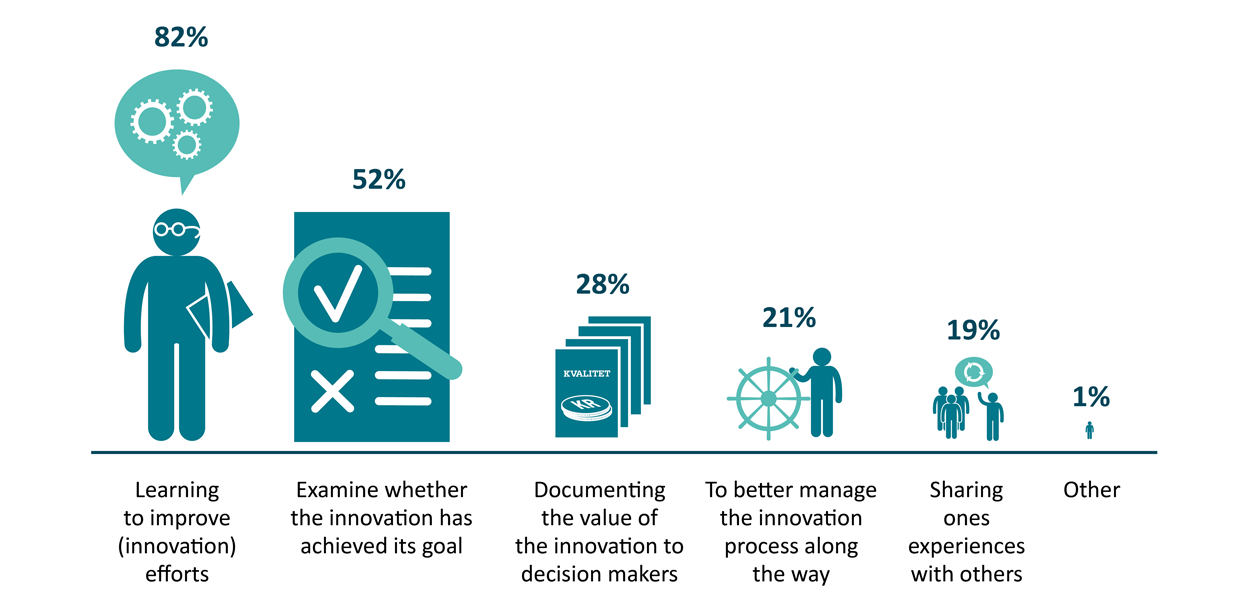
Purpose of evaluation:


2.3 Working with short case studies
The concept of public sector innovation may seem intangible, but a good example can help your Innovation Barometer message reach a broad audience. To produce a good case study, you must first find a good example of public sector innovation. This can often take a long time to find, so make an early start on identifying relevant cases and engage your network in this search.


"Finding and producing good case studies takes time. This is partly because clear and concise text takes time to produce and partly because finding good leads is time-consuming. On top of that, promising cases will prove unusable more often than one would think because the value of the innovation is not documented well enough. So, make an early start!"

Paul Sauer, Communications Manager
The National Centre for Public Sector Innovation (COI)

For a case study to work well, you must be able to demonstrate the value the innovation created. Keep in mind that this value is not limited to financial aspects. Value also includes realising political goals, improving quality, increasing efficiency, strengthening democracy or enhancing employee skills or work satisfaction. Inquire about existing documentation that verifies the value of the innovation. Formal evaluations are not a requirement, but the innovator must present some form of assessment demonstrating tangible value creation. Be sure to obtain information on what the situation was like before and after the innovation to identify the improvements generated.
Some cases might initially seem too complicated to present briefly, but sharp editing that highlights key issues can work wonders. Readers eager to learn more can contact the innovators directly.
When writing the text, emphasise the ingenuity of the solution and the value created instead of the process of getting there, no matter how fascinating and important. A good case provides a snapshot of the solution that illustrates the added value.
A good case focuses the reader’s attention. Pique curiosity and interest by taking high-quality photographs of the innovation, users, developers or where it was implemented, which can be costly, or obtain legal permission to use existing photographs.
If you are working with multiple case studies, for example in a large publication or on a website, make sure the case studies show various kinds of innovation and cover a variety of sectors and service areas. This introduces readers to a broader spectrum of public sector innovation.


ACTIONABLE ADVICE 2.9
OPEN THE DOOR WITH A CASE STUDY
- Make press releases more effective by incorporating a good example – instead of a number – in the headline. Let it be the gateway to your story. This is especially true in terms of reaching a broad(er) range of media that do not have the same veneration for public sector innovation statistics as you do, but who can identify with and see the significance of a new solution that benefits citizens.
- The next step is to immediately illustrate the example with the statistics to get the message across from the Innovation Barometer and your organisation.


USE CASE
A PUBLIC SECTOR INNOVATION CASE STORY
The template for innovation cases in the Nordic Innovation Barometer includes three items:
- A short introduction emphasising the value created.
- A description of the initial problem or situation addressed.
- A description of key aspects that solved or improved the
The two Danish Innovation Barometer books also include contact information for one or two individuals, which serves a dual purpose. First, readers can easily contact the innovators independently if they desire additional information, which is especially useful if the aim is to replicate it. Second, it prompts the innovators to share the case on, for instance social media, automatically expanding the reach of the case.


Download part 2
Download a full PDF-version of part 2: How to communicate your Innovation Barometer.
Download part 2 (PDF)


Comments
Paul Sauer (COI - Denmark)
26. januar 2021 - 11:04
Please write your own comment below.